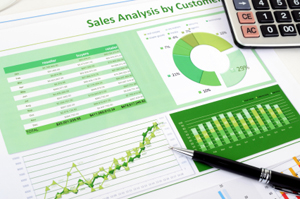
Business advisors and writers (including me) often tout the value of a dashboard as a way to keep tabs on your business without having to absorb masses of data. The follow up questions we get most often are “What is it, exactly?” or “What does it look like?” or “How does it help us?” So let’s see if I can provide some quick answers to those questions.
 A dashboard is an abbreviated summary of the financial and operational data that are most critical to the success of your business, preferably represented in a page or less of charts, graphs or images that can be instantly absorbed without having to plow through tables of numbers or paragraphs of prose. The data chosen are typically referred to as KPIs, or Key Performance Indicators, and as my most recent book says: “KPIs are the performance metrics that enable us to look at the relationships in a company’s financial numbers in a new way. KPIs are best accompanied by a benchmark, a standard against which the metric is compared to see if the company is doing better or worse than was expected or hoped for. The result is an insight that we didn’t have previously about an area that’s important to us.”
The metrics we like fall mostly into 3 categories: measures of profitability, productivity and (where appropriate) financial leverage. All these can be found – or should be – in your financial reports. But it’s far easier to relate to a metric like Gross Profit Margin if you can see a line or bar chart showing the actual GPM achieved for each of the past 6 or 12 months compared with your budgeted GPM or the industry average GPM or your previously achieved GPM. It’s instantly clear what has happened, what you wanted to happen, and how close or far apart they are. No need to scan a table of numbers. And you can easily put 6 to 10 images on a page that will give you an instantly readable picture of the business, even if the table of numbers is part of the same monthly report. The idea is to use our brains to quickly grasp important data by giving it what it needs right up front – a picture. How about these as possible metrics worth following, presented over a rolling 12 months:
For more information on this subject, check out Chapter 7 of my book, Finance for Nonfinancial Managers, 2nd Edition.
As always, I welcome your comments and feedback.
© 2024 CFO For Rent - Western Management Associates. All rights reserved. Website by Avodah Web Solutions.